
Is Being an Insurance Agent Worth It? What the Data Actually Shows
The short answer
Being an insurance agent is worth it if you can fund the months between writing business and being paid. The commonly repeated 90%-quit figure has no primary source we could open; LIMRA's own slides put four-year retention near 14% in the channels that publish it, and cash flow, not sales talent, decides most first years.
Is being an insurance agent worth it?
Yes, if you can fund the gap between writing business and being paid. No, if you cannot. That is the whole answer, and almost every other consideration — which vertical, which carrier, door-knocking versus the phone — sits downstream of it. The independent agent who survives month 18 is rarely the best closer in their cohort. They are the one who still had money in month nine.
The upside is structural, not motivational. A resident producer licence is portable across carriers and, through reciprocity, across states. A book of in-force policies pays renewals in months when you sell nothing. Nobody caps what you write, and the federal occupational outlook is not hostile: the Bureau of Labor Statistics projects employment of insurance sales agents to grow from 568,800 jobs in 2024 to 589,800 by 2034, about 4 percent, with roughly 47,000 openings a year over the decade. Those three facts are why agents who get past the second year tend to stay for decades.
The cost is structural too, and recruiting material tends to skip it. You are funding a small business — acquisition cost, licensing, E&O, a dialer — out of personal savings, while learning a regulated sales job in which your early mistakes get reversed by the carrier rather than forgiven. The first-90-days chapter covers the sequencing. This page covers what breaks, and shows its sources for every claim about how often it breaks.
What the public data actually measures — and what it does not
Almost every washout statistic in this niche fails the same way: it answers a question the underlying dataset was never built to answer. Before any figure on this page, here is the inventory of what is genuinely published about the occupation, and the boundary of each source. Read the right-hand column first.
Two boundaries in that table do the most damage when ignored. The first is that the BLS wage series is an establishment survey — the Occupational Outlook Handbook states plainly that the data "exclude self-employed workers and owners and partners in unincorporated businesses," while simultaneously reporting that 13 percent of insurance sales agents are self-employed. The independent commission-only producer, which is what most new-agent recruiting is selling, is largely outside the wage distribution people quote at them. The second is that a producer licence is a credential, not a job: the NAIC reports more than 2 million licensed individuals against a BLS occupational headcount of 568,800 jobs. Subtracting one from the other does not yield an attrition rate, and anyone who does that arithmetic in public is guessing.
Income belongs to a different page and this one does not compete for it. Our compensation analysis, with income distribution by years licensed and by lead source, owns every earnings figure on this site. The occupation-wide wage numbers below are calibration against recruiting claims, not a forecast for you.
| Source and vintage | What it publishes | What it does not measure |
|---|---|---|
| BLS Occupational Outlook Handbook, insurance sales agents (SOC 41-3021), last modified 28 August 2025 | 568,800 jobs held in 2024; 589,800 projected for 2034 (+4%, +21,100); about 47,000 openings per year; 62% in agencies and brokerages, 13% self-employed | Licences issued, and survival of anyone's first year. It counts jobs at a point in time, not entrants and exits by tenure. |
| BLS Occupational Employment and Wage Statistics, May 2025 (via the BLS public API) | 479,100 employed; median annual wage $62,280; 10th percentile $37,330; 90th percentile $138,140 | Self-employed agents and owners of unincorporated businesses, excluded by design — which is most independent producers. The May 2024 vintage quoted everywhere is $60,370 median. |
| BLS Employment Projections, occupational separations, 2024–34 annual averages | Labor-force exit rate 3.6%, occupational transfer rate 4.2%, total separations rate 7.7% — about 44,900 people a year leaving the occupation against 47,000 annual openings | New-entrant survival. This is churn across all tenures, and at 7.7% it is well below the 10.6% all-occupations rate. The occupation is stable; the entry cohort is the thing at risk. |
| NAIC producer licensing page, last updated 10 February 2025 | "There are currently more than 2 million individuals and more than 236,000 business entities licensed to provide insurance services in the United States." | How many of those 2 million write business. A licence is a credential with a renewal fee, not evidence of production. |
| LIMRA, "Building High-Performing Sales Teams," 2025 LIMRA Annual Conference (session 16) | Four-year retention of financial professionals: the industry has "been sitting at an industry-wide 4-year retention … rate of 14% for years"; for agency-building companies it "has not exceeded 20 percent" historically | Independent commission-only agents. The metric counts financial professionals still under company contract four years after hire, in career-agency and multiple-line exclusive channels. |
| InsureLeads compensation analysis (first-party): public sources, our operational data Q1 2025 – Q1 2026, and structured interviews with 40-plus active producers, January–March 2026 | Pain-point frequency, time-to-first-sale medians by entry path, income by lead source | Anything survey-grade. It has no disclosed sampling frame and no probability weighting, and we describe it as a data analysis rather than a survey for that reason. |
Is it true that 90% of insurance agents quit?
We could not find a primary source for it, and we looked. The "90 percent quit in the first year" and "only 11 percent last four years" figures circulate on recruiting sites, IMO blogs and forum posts, generally uncited or cited to each other. Nothing published by BLS, NAIC or a state insurance department produces those numbers, and the two federal datasets that come closest — occupational separations and the wage survey — are not built to measure a first-year cohort at all. Republishing a statistic you cannot open is how this lane built its credibility problem.
What does exist is narrower and more useful. LIMRA, the industry's own research body, tracks what it calls actual four-year financial-professional retention — defined in its 2024 Distribution Conference material as "the percentage of FPs who are still under contract through December of the fourth year after hire," tracked separately for agency-building, multiple-line exclusive agent and Canadian channels. In a 2025 LIMRA Annual Conference session, LIMRA's own slide states that the industry has "been sitting at an industry-wide 4-year retention … rate of 14% for years," and that historically "the average FP retention for agency-building companies has not exceeded 20 percent."
So the defensible sentence is this: in the distribution channels that actually publish retention, roughly six of every seven people hired are no longer under contract four years later. That is not the same claim as "90 percent of insurance agents quit," and the difference matters in three ways worth holding onto.
One more thing the pitch leaves out, and the reason to weigh this page differently: InsureLeads takes no IMO, FMO, sponsorship or affiliate money. Nothing here is downstream of a recruiting contract we get paid on. A recruiter is paid on contracts written, not on agents still licensed at month 24, and a downline that quits costs them nothing. "Six figures in year one" is a claim about the tail of a distribution presented as its centre — and "unlimited earning potential" is a true statement with its symmetric half removed, because commission-only work has no ceiling and no floor.
- It measures contract termination, not occupational exit. An agent who leaves a career agency to go independent counts as lost retention and is still selling insurance — which is exactly what the BLS 4.2% annual occupational-transfer rate captures separately from its 3.6% labor-force exit rate.
- It measures career and captive channels, not the independent commission-only path most new agents are recruited into. No comparable published series exists for independent producers, which is the honest state of the evidence.
- A four-year window is not a first-year window. Nothing in the LIMRA figure tells you the month-12 number, and no source found in this session does either.
Why do insurance agents quit?
Agents quit because the money runs out before the book produces, and when you ask them directly the mechanisms are specific enough to name. Asked what actually costs them time and money, producers cluster their answers around acquisition cost, reversed commissions and administrative drag — not around fear of the phone.
The ranking below is first-party and its limits are stated on the table. It comes from our compensation analysis, which combines public data (BLS, NAIC, LIMRA, CMS, published carrier schedules), InsureLeads operational data from Q1 2025 through Q1 2026, and structured interviews with 40-plus active producers conducted January through March 2026. It is a data analysis, not a controlled survey with a disclosed sampling frame, and the percentages are approximate shares of the producers interviewed rather than population estimates.
Read the table for what is absent. Two of those ten items concern selling ability. The rest are capital, data hygiene, compliance drag and distribution opacity — problems an agent can lose a year to without ever discovering that their pitch was fine. The override item at 31% is the quietest of them: an agent who cannot see where their contract sits between them and the carrier cannot tell whether a thin first year reflects their production or their commission level.
| Pain point | Share of interviewed producers raising it | Why it ends first-year careers |
|---|---|---|
| Lead quality inconsistency and misrepresented intent | 72% | A new agent cannot separate a bad list from a bad pitch, so they conclude the problem is them. |
| Acquisition cost rising faster than commission, notably Medicare Advantage | 64% | Thin unit margins go negative first for the agent with the least skill and the least volume. |
| Carrier chargebacks on life and IUL (persistency, replacement) | 58% | Money already spent gets reversed, turning a strong month into a debit balance. |
| Time lost to licensing, E&O and AHIP or carrier certifications | 51% | Unpaid weeks before the first at-bat, front-loaded onto the thinnest bank balance. |
| Dialer and CRM fragmentation, poor data hygiene | 46% | Contacts are never worked to completion, so acquisition spend is wasted invisibly. |
| Shared records delivered as exclusive | 44% | Three agents call the same person, and the newest agent loses that race every time. |
| Compliance burden (TCPA, 10DLC, state-level AI disclosure) | 39% | Unbillable hours, and one mistake carries regulatory rather than commercial consequences. |
| Seasonal income concentration (AEP and OEP dependence) | 37% | Nine good weeks have to carry twelve months, and a first-year agent has no reserve to smooth it. |
| FMO/IMO override opacity | 31% | The agent cannot tell whether a thin first year is their production or their contract level. |
| Difficulty building a referral flywheel early | 28% | The cheapest lead source is the one that takes a book you do not have yet. |
What actually ends a first year, with the threshold attached
The previous section is what producers say. This one is what the rules do, which is a different and more checkable thing. Every row below names a published threshold you can open and read, because a date or a percentage you can verify is worth more to you than any amount of encouragement.
The pattern across the rows is that the calendar and the recovery rules are set by someone else. You choose your effort; you do not choose when the selling window opens, when your certification expires, what a Medicare enrollment can pay, or how long a carrier can take money back. Budget against the thresholds, not against your production plan.
| Mechanism | The published threshold | Where to read it |
|---|---|---|
| Rapid-disenrollment clawback on Medicare Advantage | If a beneficiary makes any plan change within the first three months of enrollment, the plan must recover the compensation — regardless of which parent organization they moved to | 42 CFR 422.2274(d)(5) |
| Pro-rated commission recovery | Where full initial compensation was paid and the enrollee leaves before the end of the enrollment year, the plan must recover an amount equal to the number of months not enrolled, "including months prior to the effective date of enrollment" | 42 CFR 422.2274(d)(5) |
| Annual certification gate before you may sell Medicare Advantage | You must be licensed and appointed under state law where required, and be "trained and tested annually … and achieve an 85 percent or higher on all forms of testing" | 42 CFR 422.2274(c)(1)–(2) |
| Marketplace gate before you may sell ACA plans | You must register with the Exchange "in advance of assisting qualified individuals," receive training in the range of QHP options and affordability programs, and have executed the required agreement | 45 CFR 155.220(d) |
| Unpaid prelicensing hours before your first at-bat | California: 20 hours life/health plus 12 hours ethics and insurance code study. New York: 40 hours life/health, 90 for property and casualty. Nevada: none — prelicensing education was repealed outright | NAIC PR-20 chart (Cal. Ins. Code §§ 1749 et seq.; N.Y. Ins. Law § 2103; Nev. Rev. Stat. 683A.251) |
| Continuing education that starts before the income does | Georgia requires 24 hours per year including 3 in ethics for producers licensed under 20 years. New York requires 15 hours biennially. The spread between states is roughly threefold on an annualised basis | NAIC PR-20 chart (Ga. Code §§ 33-23-5, 33-23-16; N.Y. Ins. Law § 2132) |
| Capped revenue per Medicare sale against uncapped cost per sale | CY2026 maximum initial Medicare Advantage compensation: $694 nationally across 47 states, $781 in PA, CT, DC and NJ, $864 in CA and NJ, with renewal at exactly half. Nothing caps what you pay for the at-bat | CMS CY2026 Agent-Broker Compensation data (page last modified 26 March 2026), parsed from CMS's own extract |
| A selling year set by regulation, not by you | The annual coordinated election period runs October 15 through December 7 "beginning in 2011," with a separate Medicare Advantage open enrollment period "for 2019 and subsequent years" | 42 CFR 422.62(a)(2)(iii) and (a)(3) |
Why does the first year feel unpaid even when you are writing business?
A written application is not money. That single fact accounts for most first-year failures, because a new agent budgets against production and gets paid against issue, persistency and a premium draft clearing.
Nothing in that sequence is unusual or unfair. It is simply slower than the mental model most new agents arrive with, and the interval is where savings go. The expense side, meanwhile, does not wait: fresh exclusive final expense records list at $50 each, and final expense records 30 to 90 days old at $3 — which is why most agents in month two are working aged records priced by how old they are rather than fresh ones.
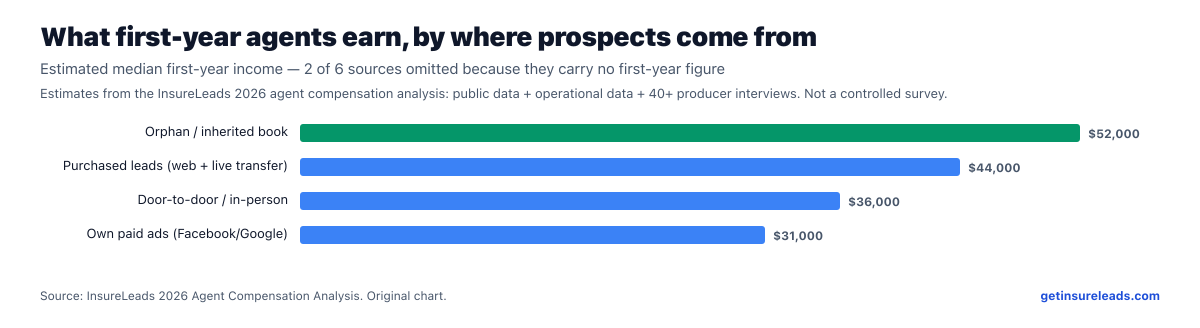
That trade has a cost, and it belongs on this page rather than on a sales page. Our own analysis puts median time to first sale at 21 to 45 days for agents working aged records only, against 12 to 21 days on exclusive web records and 4 to 8 days for trained agents on live transfers. The aged-only path is the cheapest entry and carries the highest attrition of any entry path — cheap at-bats are still at-bats you have to convert, and a new agent buying the cheapest inventory is choosing the hardest conversion problem at the moment they are worst equipped for it. How a new agent actually gets prospects works through the rest of that decision.
- You take the application and submit it. Nothing is owed to you yet.
- Underwriting reviews it. On simplified-issue final expense that is quick; on fully underwritten life it is not.
- The policy issues and the first premium drafts. Most carriers pay nothing until that draft clears.
- Commission is either paid as-earned — a slice each month the policy stays in force — or advanced, meaning the carrier fronts part of the first-year commission and recovers it from future premiums.
- The recovery window runs. On Medicare Advantage its shape is published: any plan change inside the enrollee's first three months triggers full recovery, and a later exit inside the enrollment year is recovered pro rata by months not enrolled, under 42 CFR 422.2274(d)(5). On life and IUL business our own analysis flags months 1 through 13 as the heaviest exposure, and carrier schedules rather than regulation set the terms.
- Only once that window closes is the money unconditionally yours.
What is a chargeback, and why does it end careers?
A chargeback is the carrier taking back commission it already paid you, and it is the mechanism most new agents have never had explained before it happens to them. Paid as-earned, you receive commission monthly while the policy stays in force, and there is nothing to reverse. Advanced, the carrier pays a portion of the first-year commission up front and recovers it out of the policy's future premiums.
On Medicare Advantage you do not have to take anyone's word for how this works, because the rule is federal and specific. Under 42 CFR 422.2274(d)(5), if a beneficiary makes any plan change within the first three months of enrollment — rapid disenrollment, regardless of which parent organization they move to — the plan must recover the compensation. If they leave later in the enrollment year, the recovery is pro-rated to the number of months not enrolled, and the regulation counts months prior to the effective date of enrollment in that arithmetic. Life and IUL business has no equivalent public rulebook; there the terms sit in the carrier's schedule, which is why 58 percent of the producers we interviewed raised persistency and replacement chargebacks as a live operational problem, third on their list.
The compounding version is what ends careers. An agent on advances writes a strong month, spends the advance on acquisition cost and living expenses, loses several of those policies inside the recovery window, and opens the following month with a negative statement, no cash, and no way to buy the at-bats that would dig them out. Contract level, advance percentage and how a carrier recovers a debit balance are contract mechanics rather than career questions — how contract levels and commission rates are set covers them properly.
The defensive move is not clever. Take as-earned, or take a lower advance percentage, until you have watched a cohort of your own policies clear its recovery window and you know your real persistency. That decision costs you speed in year one and buys you the ability to still be licensed in year two.
A worked example: what one Medicare selling season can pay, at its ceiling
Numbers make this concrete in a way argument does not, so here is the arithmetic for the single most common new-agent entry point, built only from published thresholds. This is a ceiling calculation with the recoveries applied, not a forecast and not an earnings claim — income by tenure lives on the compensation analysis linked earlier.
Take a newly licensed California agent who certifies over the summer, clearing the 85 percent testing threshold that 42 CFR 422.2274(c)(2) requires before they may sell Medicare Advantage at all, and works the annual coordinated election period — October 15 to December 7 under 42 CFR 422.62(a)(2)(iii). Say they write ten Medicare Advantage enrollments in that window, every one effective January 1.
California sits in the top CMS compensation tier, so the maximum initial compensation is $864 per enrollment for CY2026. Ten enrollments is therefore a gross ceiling of $8,640 — and every dollar of it is earned on business effective in January, not in the months of certifying, buying data and dialing that produced it. Now apply two entirely ordinary events. One enrollee switches plans in February, inside their first three months: that is rapid disenrollment, and the full $864 is recovered under 42 CFR 422.2274(d)(5). A second disenrolls at the end of July, five months short of the enrollment year: the recovery is pro-rated by months not enrolled, roughly $360. The ceiling is now about $7,416, arriving from January onward, against acquisition spend and unpaid certification hours that started the previous summer.
Three things follow, and they are the reason this page exists. The season is nine weeks and it is set by regulation, so a first year with one line of authority has one shot at it. The revenue per sale has a legal cap while the cost per sale does not, which is the arithmetic behind the 64 percent of interviewed producers who named acquisition cost outrunning commission. And the recovery window outlasts the selling window by months, so the number on your December statement is not yet yours. An agent who plans against $8,640 and spends it in January is the agent who is gone by summer.
Who survives the first 24 months?
The agents who reach month 24 share four unglamorous things rather than a personality type: enough cash to cover living costs and acquisition cost across the gap, one vertical instead of four, a single place where every contact and follow-up lives, and a weekly close-rate number they actually look at. None of that is charisma, and all of it is decided before the first dial.
Read the table as time to first sale, not time to first paycheck — add the issue, draft and recovery sequence above to every row. It is also the argument for fixing data hygiene before increasing acquisition spend: 46% of producers interviewed named dialer and CRM fragmentation as a pain point, and records dying in a spreadsheet are indistinguishable, from the inside, from records that were bad. A single-user CRM that stays free removes that variable at no cost, which matters most precisely when cash is the binding constraint.
The other lever is choosing a licensing and certification path you can actually finish on your savings, because those hours are unpaid and they vary enormously by state and by line. New York asks 40 prelicensing hours for life and health where Nevada asks none, and Georgia's 24 continuing-education hours a year is roughly three times New York's biennial 15 on an annualised basis — the state-by-state licensing and CE requirements carry the full 51-jurisdiction picture with the statute cited for each. If Medicare is your line, the annual recertification is a fixed unpaid cost every year rather than a one-off, and what the AHIP certification involves and when it has to be redone is the detail that catches first-year agents out.
| Entry path | Median time to first sale | What it costs you |
|---|---|---|
| New agent, trained scripts, live transfers | 4–8 days | Fastest at-bats, highest cost per acquisition until scripting improves. |
| New agent, exclusive web records | 12–21 days | The most common entry path; requires dialing discipline. |
| New agent, aged records only | 21–45 days | Cheapest path, hardest conversion, highest attrition. |
| New agent, referrals and warm market | 30–90 days | Free, and capped entirely by how deep your network already is. |
| Experienced agent switching vertical | 3–10 days | Scripts and objection handling transfer quickly; product knowledge does not. |
So is it worth doing anyway?
Worth it for a specific person: one with runway measured in months rather than weeks, who wants to build an asset instead of hold a position, and who can tolerate a variable income long enough for renewals to start smoothing it. The renewals are real, the licence is portable, and nobody caps production. The federal projection of roughly 47,000 openings a year over 2024–34 says the demand side is not the problem.
Not worth it — and this is the part the section exists to say plainly — if you need income this quarter. Commission-only insurance sales is the wrong instrument for that requirement. It is a business with a negative-cash-flow onboarding period, and no work ethic shortens the interval between an issued policy and a cleared draft, or moves the October 15 date that opens the Medicare season. Agents who quit at month five in that position did not fail at sales. They were sold a product that required capital they did not have, by someone who knew the requirement and did not mention it.
Every honest answer to this question is a conditional one. Anyone giving you an unconditional answer about a commission-only career — in either direction, including the people who quote 90 percent quit rates they cannot source — is telling you about their business model, not about yours. The test to apply to any figure you are shown, including the ones above, is whether you can open the source.
Frequently asked questions
Is it true that 90% of insurance agents quit in the first year?
No verifiable primary source for that figure could be found. Nothing published by BLS, NAIC or a state insurance department produces it. The closest real measurement is LIMRA's: its 2025 Annual Conference material states the industry has "been sitting at an industry-wide 4-year retention … rate of 14% for years," and that agency-building retention has historically "not exceeded 20 percent." That counts financial professionals still under company contract four years after hire in career and captive channels — not independent commission-only agents, and not a first-year rate.
Why do most insurance agents quit?
They run out of money before the book produces. In our compensation analysis the pain points producers raise most often are lead-quality inconsistency (72%), acquisition cost rising faster than commission (64%) and carrier chargebacks on life and IUL persistency (58%) — capital and administrative problems, not selling-ability problems. Only two of the ten items on that list concern sales skill at all.
What does the BLS say about the insurance agent job outlook?
The Occupational Outlook Handbook reports 568,800 jobs held in 2024, projects 589,800 by 2034 — 4 percent growth, about as fast as average — and estimates roughly 47,000 openings a year over the decade, most from workers transferring to other occupations or leaving the labor force. BLS Employment Projections puts total annual separations for the occupation at 7.7 percent, below the 10.6 percent rate for all occupations.
Is being an insurance agent worth it in 2026?
It is worth it if you can fund living costs plus acquisition cost across the interval between writing business and being paid. It is not worth it if you need income this quarter. That interval, not licensing difficulty and not sales talent, is the variable that decides most first-year outcomes — and on Medicare business the length of it is set by federal rule rather than by you.
What is a commission chargeback, and how long is the window?
A chargeback is the carrier recovering commission it already paid you because the policy lapsed, was replaced or was rescinded before the commission was earned. On Medicare Advantage the window is published: 42 CFR 422.2274(d)(5) requires full recovery if the beneficiary makes any plan change within the first three months of enrollment, and pro-rated recovery by months not enrolled if they leave later in the enrollment year. On life and IUL the terms sit in the carrier's schedule; our analysis flags months 1 through 13 as the heaviest exposure.
How much money should a new insurance agent have saved before starting?
No sourced figure exists for this, so treat it as arithmetic rather than a rule of thumb: monthly living costs, plus monthly acquisition spend, multiplied by the number of months between your first sale and your first unconditional commission. Our analysis puts median time to first sale between 4 and 45 days depending on entry path; underwriting, issue, the first premium draft and the recovery window all sit on top of that.
How long before a new agent makes their first sale?
Medians from our compensation analysis: 4 to 8 days for a trained agent on live transfers, 12 to 21 days on exclusive web records, 21 to 45 days working aged records only, and 30 to 90 days on referrals and warm market. First sale is not first paycheck — add underwriting, issue and the first premium draft, then the chargeback window before the money is unconditionally yours.
Do insurance agents get paid a salary?
Independent agents generally do not — compensation is commission plus renewals, paid after a policy issues and its first premium clears. Some captive and agency-employed roles carry a base or a draw against commission, which trades earning ceiling for cash-flow stability. Note that the BLS wage figures people quote come from an establishment survey that explicitly excludes self-employed workers, so they describe the salaried and agency-employed end of the occupation better than the independent end.
Sources
- https://www.bls.gov/ooh/sales/insurance-sales-agents.htm — BLS Occupational Outlook Handbook, insurance sales agents (SOC 41-3021), last modified 28 August 2025: 568,800 jobs held in 2024; 589,800 projected 2034; +4% and +21,100 for 2024–34; "About 47,000 openings for insurance sales agents are projected each year, on average, over the decade"; largest employers 62% insurance agencies and brokerages and 13% self-employed; May 2024 median annual wage $60,370, lowest 10% under $36,390, highest 10% above $135,660; and the verbatim methodological limit "The data exclude self-employed workers and owners and partners in unincorporated businesses." Fetched 2026-08-11 (bls.gov served 200 to the scraping route used, not 403).
- https://www.bls.gov/emp/tables/occupational-separations-and-openings.htm — BLS Employment Projections, "Occupational separations and openings, projected 2024–34." Verbatim row for Insurance sales agents / 41-3021: employment 568.8k → 589.8k, +21.1k, +3.7%; labor force exit rate 3.6, occupational transfer rate 4.2, total occupational separations rate 7.7 (2024–34 annual averages); labor force exits 20.7k, occupational transfers 24.2k, total separations 44.9k, occupational openings 47.0k per year. Comparison row Total, all occupations: total separations rate 10.6. Source line: Employment Projections program, U.S. Bureau of Labor Statistics; last modified 28 August 2025. Fetched 2026-08-11.
- https://api.bls.gov/publicAPI/v2/timeseries/data/OEUN000000000000041302113 — BLS OEWS via the public API: median annual wage for insurance sales agents (SOC 41-3021), national, all industries = $62,280 for annual 2025 (period A01). Fetched 2026-08-11; series returned 2025 only.
- https://api.bls.gov/publicAPI/v2/timeseries/data/OEUN000000000000041302111 — BLS OEWS via the public API: 10th-percentile annual wage for insurance sales agents (41-3021), national = $37,330 for annual 2025. Fetched 2026-08-11.
- https://api.bls.gov/publicAPI/v2/timeseries/data/OEUN000000000000041302115 — BLS OEWS via the public API: 90th-percentile annual wage for insurance sales agents (41-3021), national = $138,140 for annual 2025. Fetched 2026-08-11.
- https://api.bls.gov/publicAPI/v2/timeseries/data/OEUN000000000000041302101 — BLS OEWS via the public API: national employment for insurance sales agents (41-3021) = 479,100 for annual 2025 — the wage-and-salary establishment count, used on the page specifically to contrast with the OOH's 568,800 jobs-held figure that includes the self-employed. Fetched 2026-08-11.
- https://content.naic.org/insurance-topics/producer-licensing — NAIC verbatim: "There are currently more than 2 million individuals and more than 236,000 business entities licensed to provide insurance services in the United States." Page last updated 2/10/2025. Used as the licences-are-not-jobs boundary, explicitly not as an attrition input. Fetched 2026-08-11.
- https://www.limra.com/globalassets/limra-loma/events-learning-and-networking/conferences/2025/limra-annual-conference/session-16-building-high-performing-sales-teams.pdf — LIMRA, "Building High-Performing Sales Teams: Strategies for Talent Acquisition and Retention," 2025 LIMRA Annual Conference session 16 (Kathy Reid, VP Members Solutions, LIMRA and LOMA). Verbatim: "The actual four-year FP retention shows the percentage of FPs who are still under contract through December of the fourth year after hire. Historically, the average FP retention for agency-building companies has not exceeded 20 percent." and "We have been sitting at an industry-wide 4-year retention of rate of 14% for years." This is the only citable retention figure found in this session and it is the page's replacement for the unsourced 90%-quit claim. Fetched 2026-08-11.
- https://www.limra.com/globalassets/limra-loma/events-learning-and-networking/conferences/2024/distribution-conference/presentations/session-11-strengthening-advisor-retention-and-attracting-new-talent.pdf — LIMRA, "Strengthening Advisor Retention and Attracting New Talent," 2024 LIMRA Distribution Conference session 11 (Meg Vecchi, Guardian Life; Matt Walker, Thrivent). Supports the definition of the metric — "the percentage of FPs who are still under contract through December of the fourth year after hire" — and that LIMRA tracks it separately for Agency-Building, MLEA and Canada channels. Its numeric year-by-year series was deliberately NOT quoted on the page: the PDF's table extracted with ambiguous row/column alignment and its top row conflicts with the 2025 deck's "not exceeded 20 percent" statement. Fetched 2026-08-11.
- https://www.ecfr.gov/current/title-42/chapter-IV/subchapter-B/part-422/subpart-V/section-422.2274 — 42 CFR 422.2274, "Agent, broker, and other third-party requirements." Verbatim: agents must "[b]e trained and tested annually as required under paragraph (c)(4) of this section, and achieve an 85 percent or higher on all forms of testing" and "[b]e licensed and appointed under State law (if required under applicable State law)"; compensation must be recovered where "[a] beneficiary makes any plan change (regardless of the parent organization) within the first three months of enrollment (known as rapid disenrollment)"; and "[f]or other compensation recovery, plans must recover a pro-rated amount of compensation … equal to the number of months not enrolled," counting "months prior to the effective date of enrollment." Also the definition of "initial enrollment year." Fetched 2026-08-11.
- https://www.ecfr.gov/current/title-42/chapter-IV/subchapter-B/part-422/subpart-B/section-422.62 — 42 CFR 422.62, "Election of coverage under an MA plan." Verbatim (a)(2)(iii): "Beginning in 2011, the annual coordinated election period for the following calendar year is October 15 through December 7"; and (a)(3) "Open enrollment period for individuals enrolled in MA — (i) For 2019 and subsequent years." Supports the claim that the Medicare selling window is statutory, and the nine-week framing in the worked example. Fetched 2026-08-11.
- https://www.ecfr.gov/current/title-45/subtitle-A/subchapter-B/part-155/subpart-C/section-155.220 — 45 CFR 155.220(d): an agent or broker enrolling individuals through the Exchange must comply with an agreement under which they at least "(1) Register[] with the Exchange in advance of assisting qualified individuals enrolling in QHPs through the Exchange; (2) Receive[] training in the range of QHP options and insurance affordability programs; and (3) Compl[y] with the Exchange's privacy and security standards." Also (d)(1)(i)–(ii) on the executed agreement under § 155.260(b) and registration with the Federally-facilitated Exchanges. Note: the regulation itself states no frequency, so the page does not claim an annual cadence from this citation. Fetched 2026-08-11.
- https://www.cms.gov/medicare/health-drug-plans/managed-care-marketing/medicare-marketing-guidelines/agent-broker-compensation — CMS Agent Broker Compensation page — confirms the existence and current posting of "CY 2026 Agent-Broker Compensation Data (ZIP)" and gives Page Last Modified 03/26/2026 10:19 AM. This is the authority behind the CY2026 maximum initial compensation tiers used on the page ($694 national across 47 states, $781 PA/CT/DC/NJ, $864 CA/NJ, renewal exactly half), which the repo parsed from that ZIP's Preprocessed_ABC_Extract_CY2026_A.csv. Fetched 2026-08-11.
- https://content.naic.org/sites/default/files/model-law-chart-pr-20-producer-education-and-examination-requirements.pdf — NAIC model-law chart PR-20, "Producer Education and Examination Requirements." Verbatim California cell (review date 4/24): "20 hours P/C, 20 hours L/H, 20 hours personal lines broker-agent; plus 12 hours ethics and insurance code study" and "24 hours during each 2-year license term … of which 3 hours must be in ethics." Verbatim New York cell (4/24): "90 hours P/C; 40 hours L/H" and "15 hours biennially." Plus the NAIC disclaimer reproduced on the page. Nevada's repeal (Nev. Rev. Stat. 683A.251) and Georgia's annual 24-hour CE requirement (Ga. Code §§ 33-23-5, 33-23-16) come from the same chart as carried in src/data/licensing-by-state.js. Fetched 2026-08-11.